An interactive web map (link to the live map) to assist the planning of horse riding routes around the Fannyhof stable.
About the Web Map
In my free time I enjoy horse riding out in the countryside once every week, in a small group of friends. While just heading out without a concrete plan of where to go can be fun too, it also makes sense to plan a ride, at least roughly. This is harder than it sounds. One needs to get the timing right and be back neither too soon nor too late. Additionally, rides are more interesting and varied when they include some 'activities', such as bathing in the river during summer, go 'climbing' at a steep hill, or purposely walking past a farm the horses perceive as 'dangerous' (which it is not). Most of those activities also have a purpose. For example, going into the cool river in summer is good for the horses’ joints, and passing a 'dangerous' spot will train the rider's ability to provide the horse with a sense of security and trust.
This web map was designed to help with this planning process and is thus targeted at a very small user group that knows the area of interest reasonably well. It provides an overview of available activities and where they are located and calculate a round trip passing by a a set of activities specified by the user.
Data
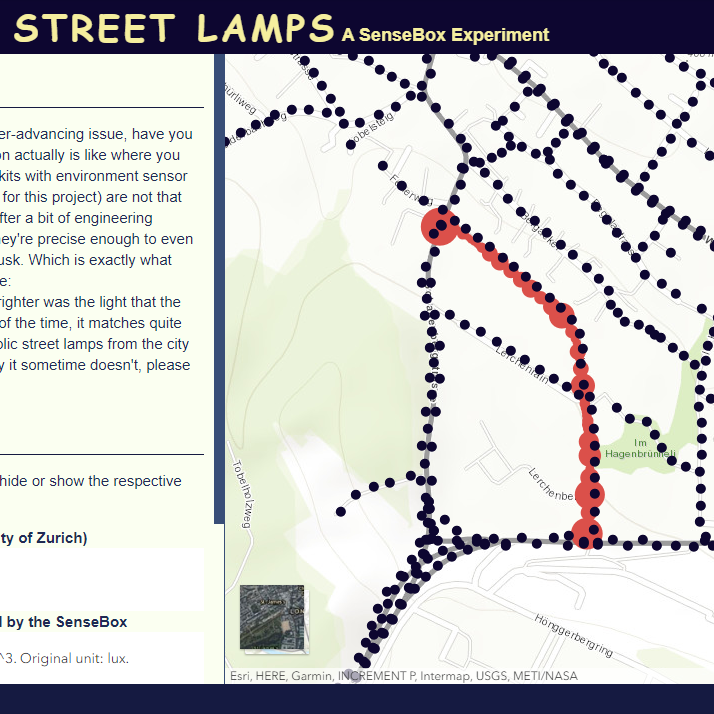
Regular roads and most man-made constructions are things most horse riders would rather avoid. In turn, there are many objects not represented in vector data (even in Open Street Map data) that are important, such as patches of walkable grass or whether a path has a green centre strip. The map therefore uses the default satellite imagery without any labels or other overlays as a base map. The data for the activities was created based on my personal experience and knowledge. Naturally, the map only covers the area around the Fannyhof stable.
Main Functionalities
The web map was created with the Google Maps JavaScript API and provides three main functionalities:
- Clicking on a specific activity in the map provides context information and an photo if available. The activities are clustered when zooming out.
- The activities are classified into categories (e.g., climbing, drinking spot) and one can hide or show activities on the map based on their category.
- A routing service calculates the shortest round trip to pass by a selected number of activities and outputs the trip's distance and duration. This calculation also asks the user to specify the planned percentages of the trip to be covered in walk, trot, and canter as well as the respective speeds.
Limitations
The main takeaway from this project was that the routes suggested by Google's routing service are often not the routes a rider knowledgeable of the area would take. There are two main reasons for this.
Google's routing service is designed for people driving vehicles or walking. Therefore, the underlying network consists mainly of roads, paths and squares. Meadows, passable woods and fallow fields that you are allowed to cross—which mostly depends on how well you know their owner—are missing. Yet these are much welcomed routes on horseback.
In addition, the implemented routing functionality neglects the fact that some activities are actually a path rather than a single point, such as gallop tracks. In extreme cases, the routing service thus suggests routes that are actually not feasible in reality.
Graphical User Interface DesigN
The GUI was kept simple but fully responsive. It consists of a fixed navigation bar on the right from which one can open or close the three foldable navigation panes for the context information display, the activity categories, and the routing. The entire map is framed by a header at the top and a footer at the bottom from which one can access the popups showing the imprint, information about how to use the web map, and the used sources. The overall colour concept is based on the earthy colours of the Fannyhof stable's own website.
Source Code
The source code is available on GitHub. The live web map is also hosted using GitHub Pages.
Credits and Acknowledgement
This web map was created as a student exercise during the course "Cartography III" in fall 2018 at the Institute of Cartography and Geoinformation, ETH Zurich.