An interactive digital campus map that uses eye-tracking technology to allow hands-free map navigation.
About the Map
The interactive campus map prototype was developed for people that come to the Info Center on the ETH Zurich's Hönggerberg campus and ask for directions: mainly students, visitors, and employees. For such a setting, gaze input has a several advantages in comparison to touch input (touch screens), such as less hygienic concerns. Therefore, the map is powered by soft- and hardware that integrates eye-tracking technology.
Functionalities
Beyond the hands-free navigation, the interactive map offers three main functionalities:
- Simply showing the campus map
- Visualizing points of interest (e.g. cafeterias, libraries), rooms, and buildings
- Displaying directions (outdoor and indoor) in the form of routes to points of interest or rooms
- Simply showing the campus map
- Visualizing points of interest (e.g. cafeterias, libraries), rooms, and buildings
- Displaying directions (outdoor and indoor) in the form of routes to points of interest or rooms
These functionalities are provided in a simple and easily understandable way, as the above-described target group covers a wide range of social circles from highly educated and technology-affine researchers to simple delivery men that might have never seen an eye tracker or similar technology before.
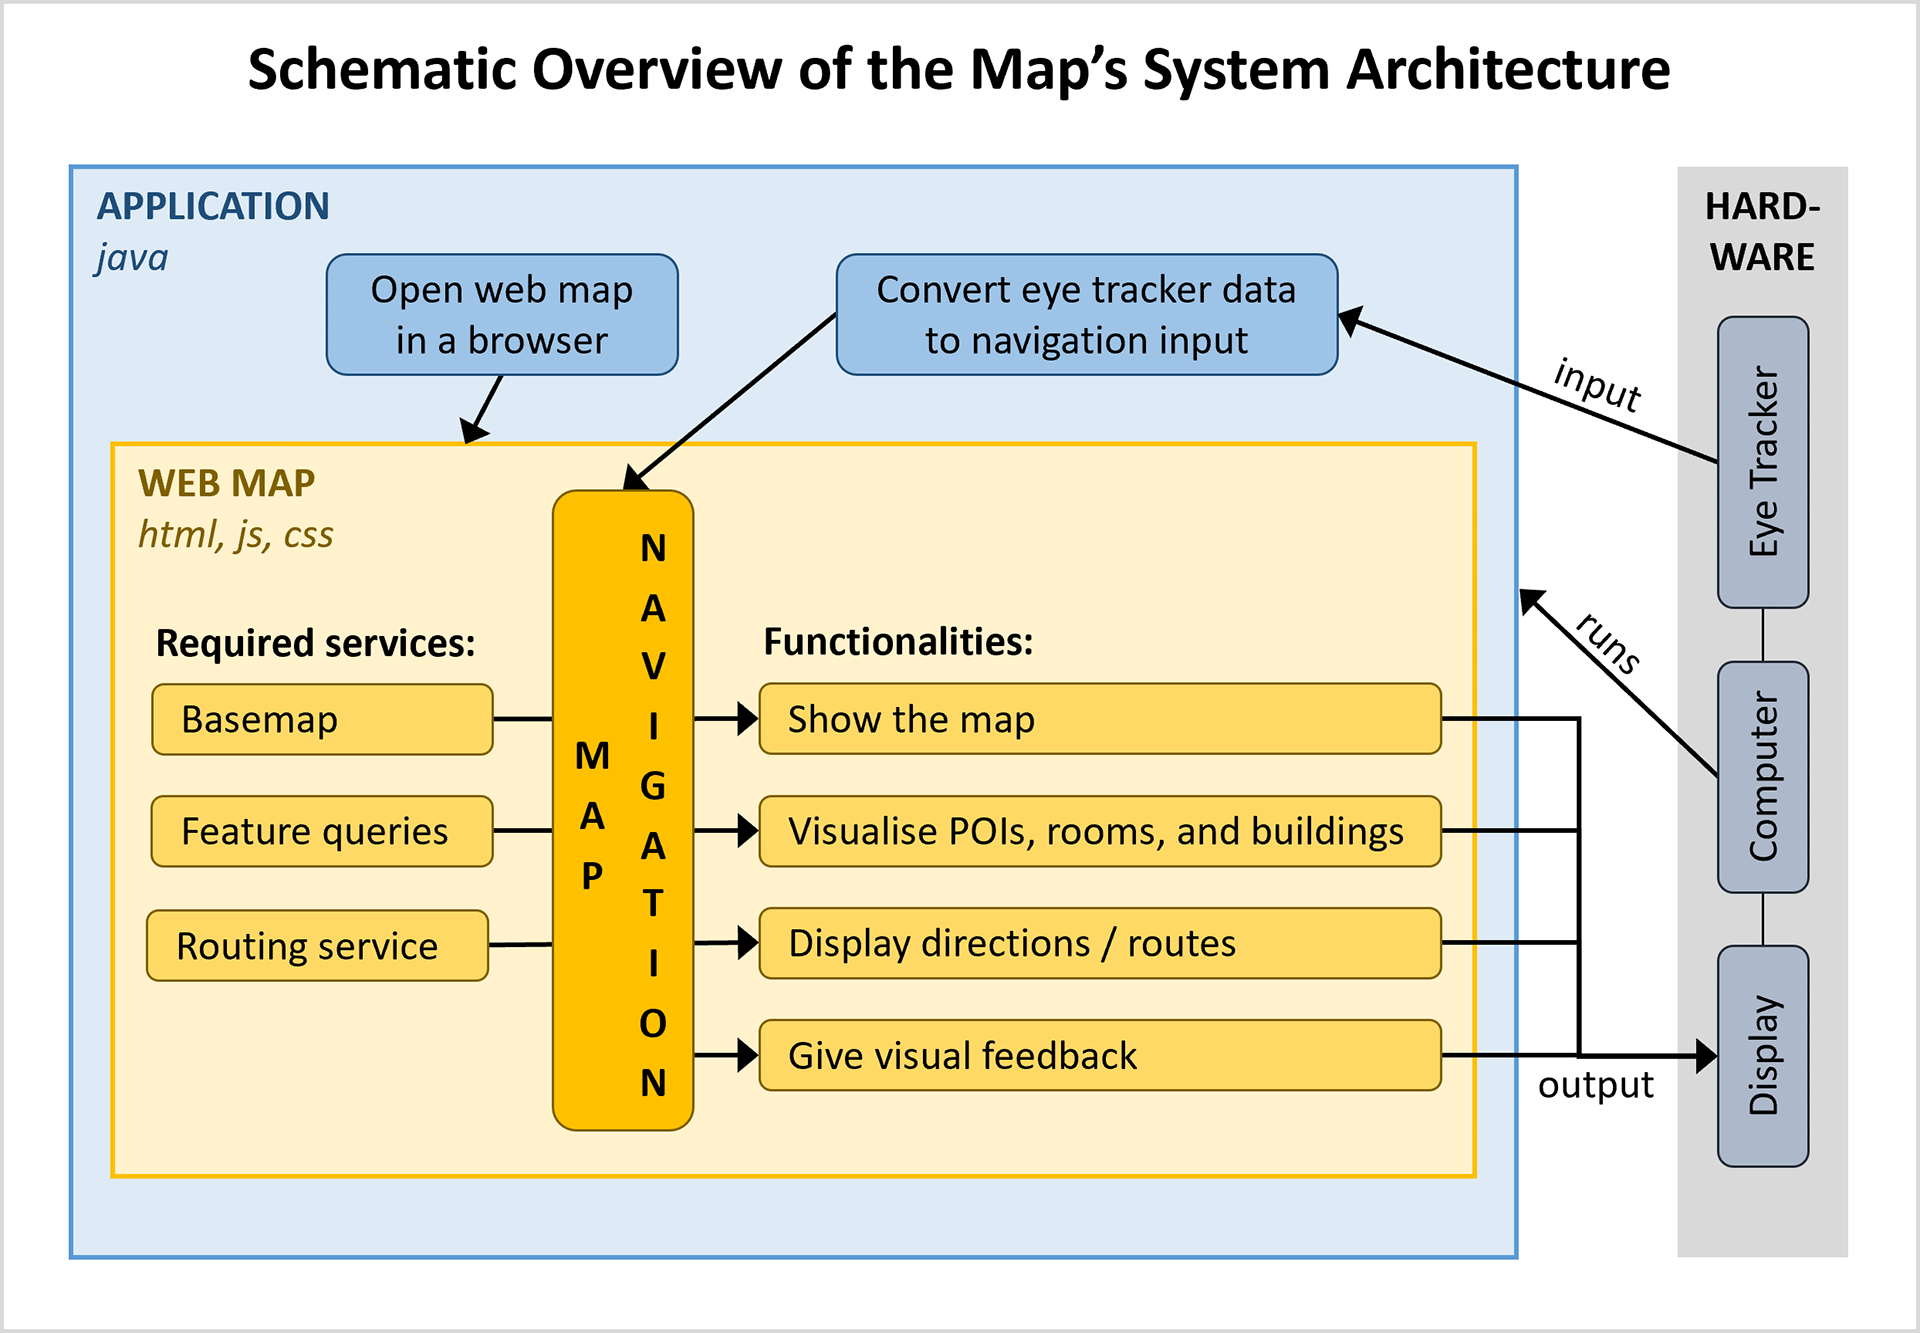
System Architecture
The entire system consists of a setup of coordinated hardware and software. The main hardware components are a big screen for showing the map, the eye tracking unit (Tobii TX300 Eye Tracker), and a computer that runs the main controlling application. This application—a single Java program—starts the actual web map in a full-screen web browser and converts the data it receives from the eye tracker into navigation input for an interactive web map. This web map integrates a simple base map of ETH Zurich's Hönggerberg campus, a 3D routing service (for indoors across floors), and a way to query the features that should be visualized or routed to. Most importantly, the web map gives the user visual feedback of his interaction with the system.
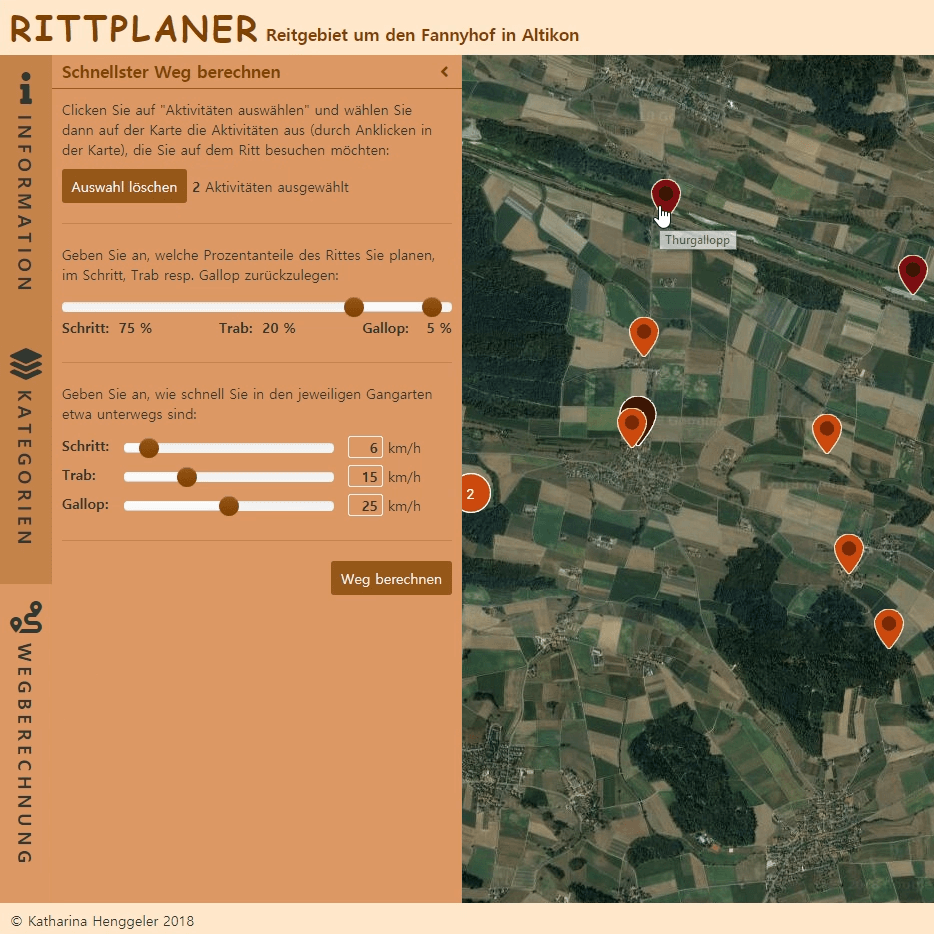
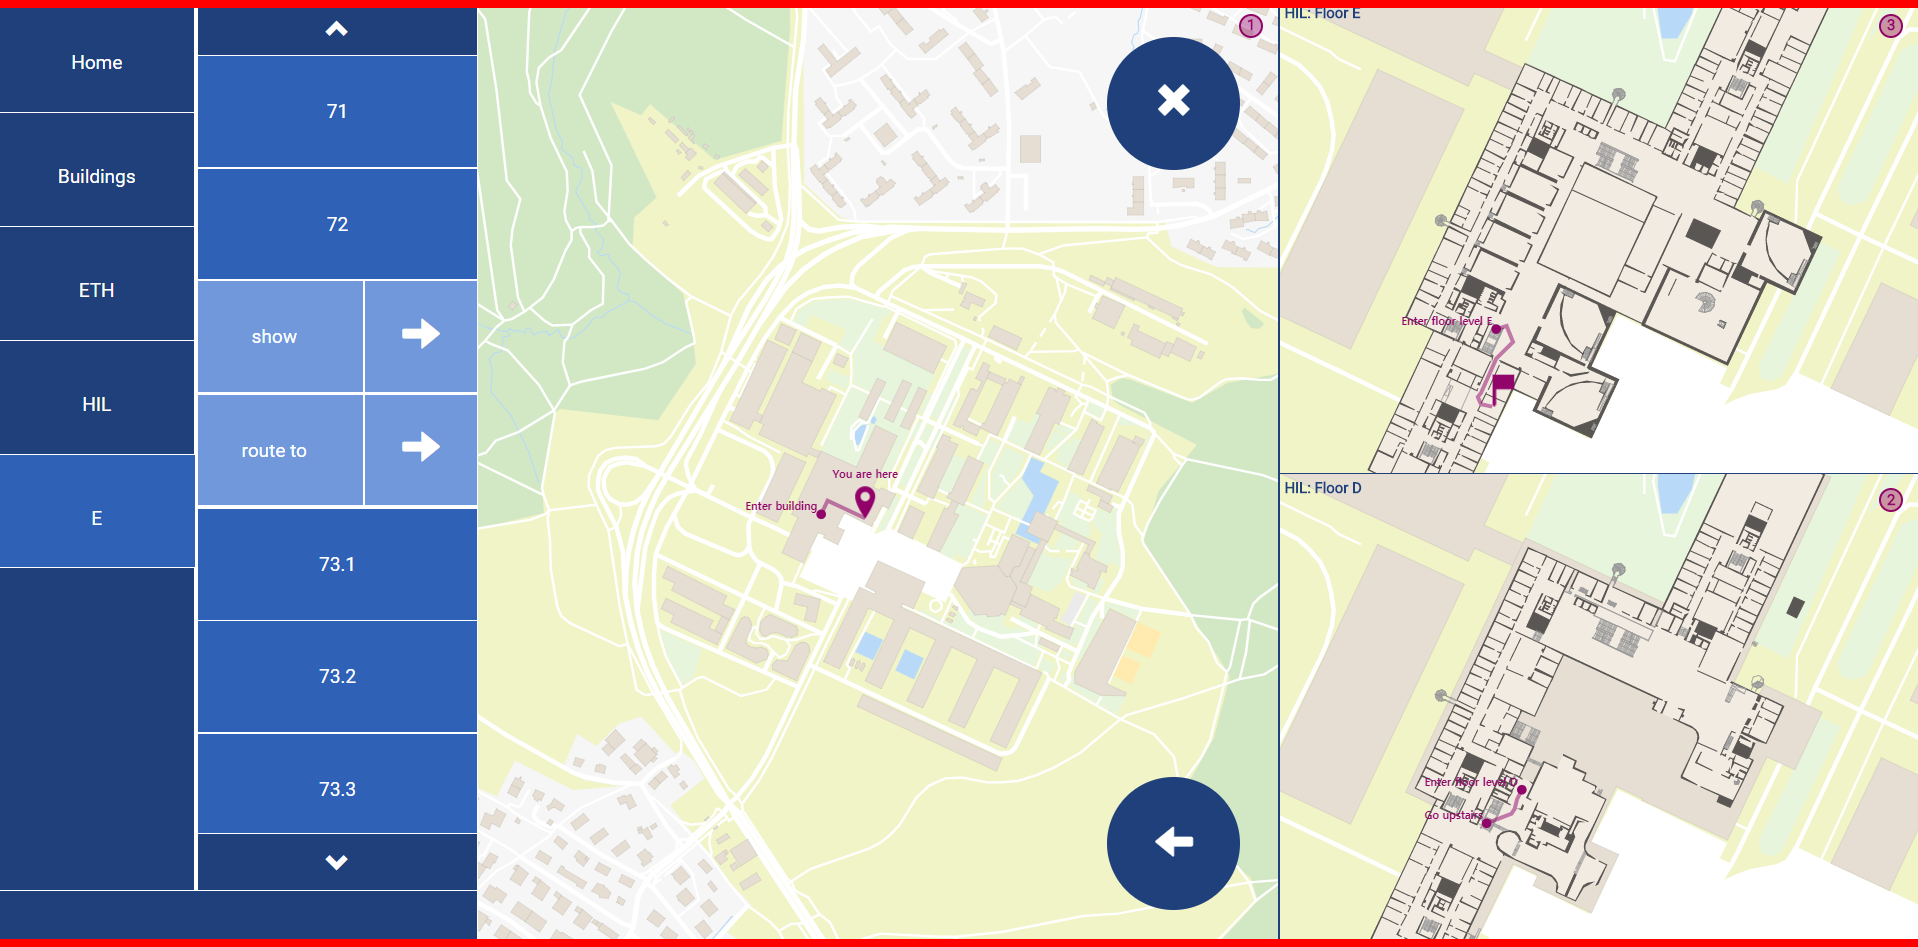
Graphical User interface Design
Because gaze input also has some drawbacks, the GUI design was specifically tailored to the gaze input method. Gaze input is less accurate than mouse or touch input; it allows no two-finger navigation and no swiping. Therefore, the GUI design features large buttons resulting in a blocky and overall very simple design:
Data and Tools
The outdoor geodata for the map was downloaded from Open Street Map. The indoor data of the campus buildings, the floor plans, was provided by ETH Zurich. Particularly the indoor data needed to be heavily processed before it could be integrated into the system using QGIS, FME, ArcMap, and ArcGIS Pro (incl. custom ArcPy scrips for omputation- and time-intensive processes). The data was then uploaded to the ETH Zurich Portal for ArcGIS and integrated into the web app via the ArcGIS JavaScript API.
Routing
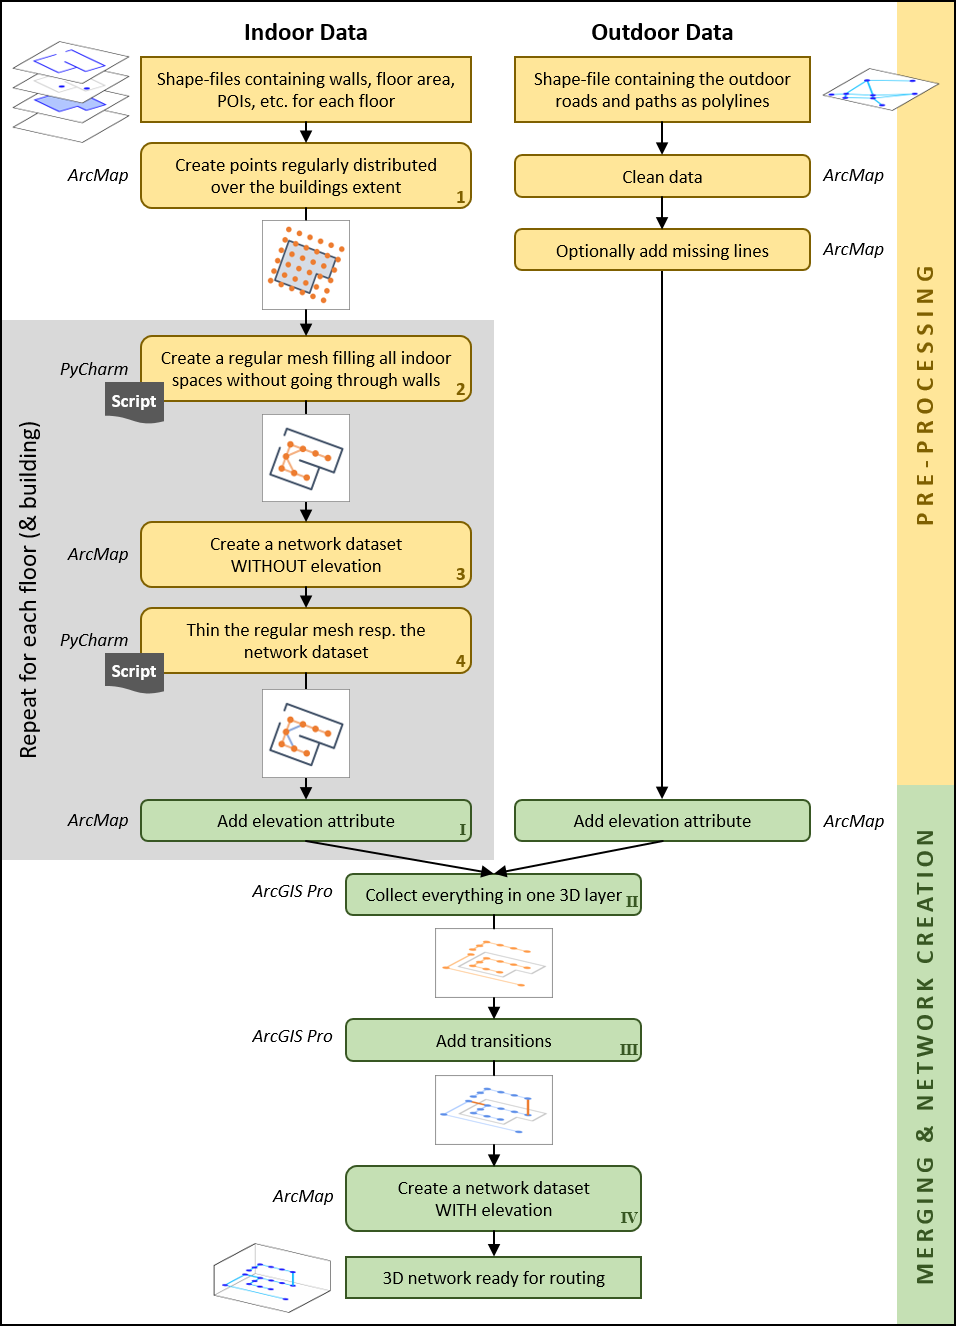
Developing this interactive campus map was a teamwork. My main contribution was the routing functionality. In order to create a routing service on the Portal for ArcGIS, which can then be integrated into the web map with the ArcGIS JavaScript API, a routing network consisting of all possible paths to walk on is needed. Whereas the outdoor vector data of the roads and paths was basically ready-to-use, safe for a bit of data cleaning, the indoor data needed more pre-processing. Therefore, the main work went into extracting a network of polylines from the data and—together with the outdoor data—combine them into to a three-dimensional network.
Since the Campus Viewer Tools that Esri had developed for this very task did not work with our data, I developed a workflow that follows similar concepts and ideas, but does not need the Esri toolset itself. This workflow consists of two main parts: First, all the data is pre-processed to create planar networks (meaning no height information). These planar networks are then put together and combined with the outdoor network (also planar) to form the desired 3D routing network. The figure below gives a schematic overview of this workflow:
Credits and Acknowledgements
This app was developed together with fellow students Nikolaos Bakogiannis, Roswita Tschümperlin, and Yang Xu. It was a student project during the course "Interdisciplinäre Projektarbeit" in fall 2018 at the Institute of Cartography and Geoinformation, ETH Zurich.